If you have received a ClickFlare report from your partner or associate, here are the most important things to know.
How to Open the Report
You have most likely received a link from your associate. You simply need to click on it or copy-and-paste it on your browser.
How to View the Report
The primary view is a table containing data that the ClickFlare user has decided to share with you. While you can use filters and adjust minor settings, editing the data itself is restricted. If you require additional data, please contact your associate.
In this report, you will see the:
- Report name: As determined by your associate.
- Time range: Again, your associate has selected the time range of data you see on this report.
Note: If the time frame is dynamic, such as Last 14 Days, the data in this report will automatically be updated to reflect this chosen range.
- Columns: These have been pre-selected by your associate. If you need additional explanations or metrics, please contact them to update the report.
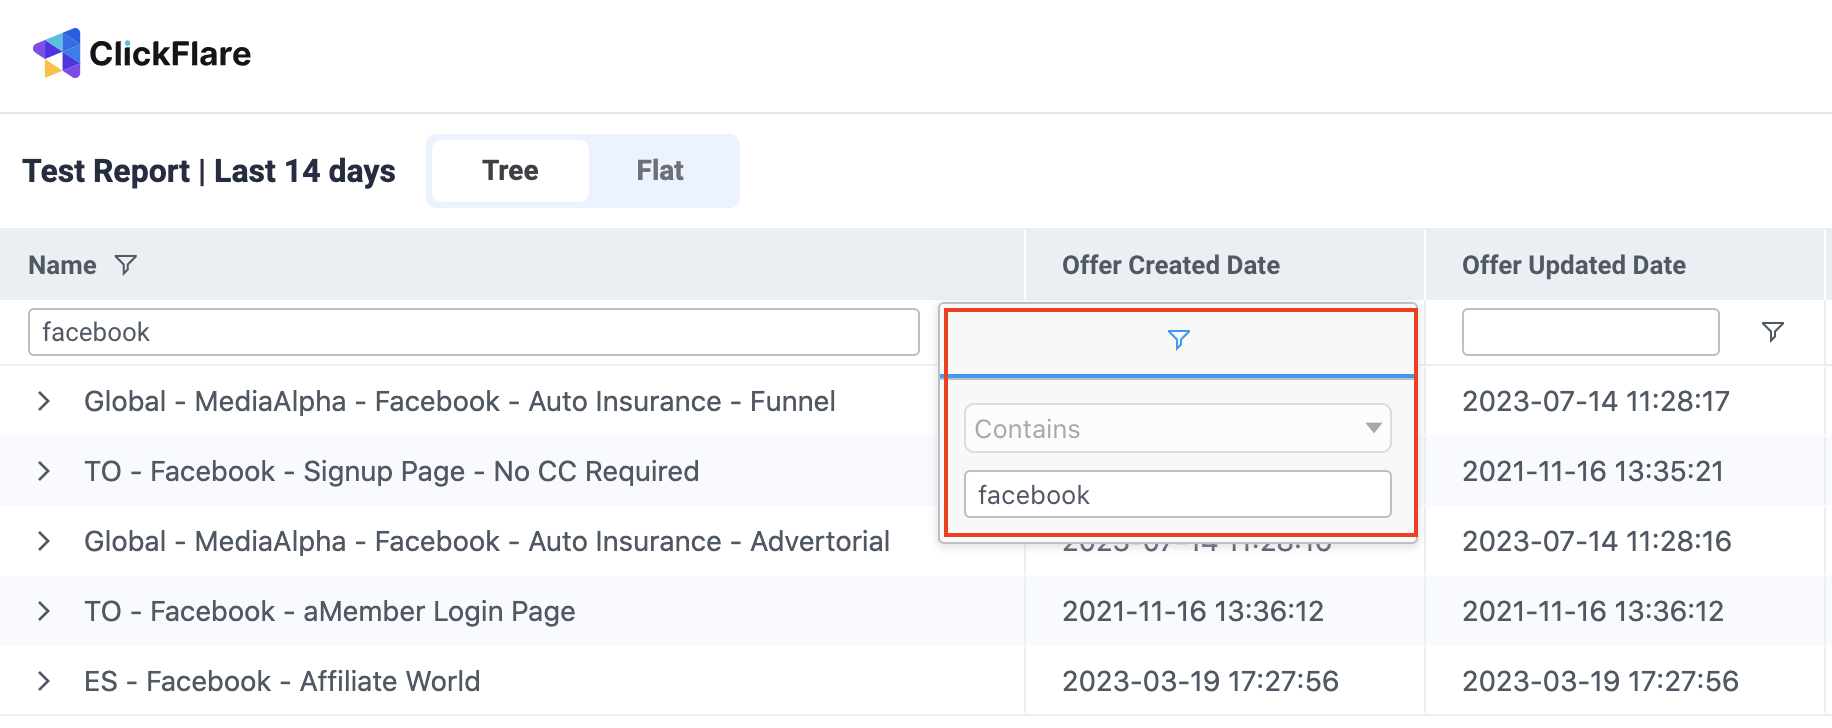
- Filters: To find the data you need, you can apply filters on all columns. For example, if you are specifically looking for campaigns containing "Facebook" in their name, you can apply the filter on your campaign name column.

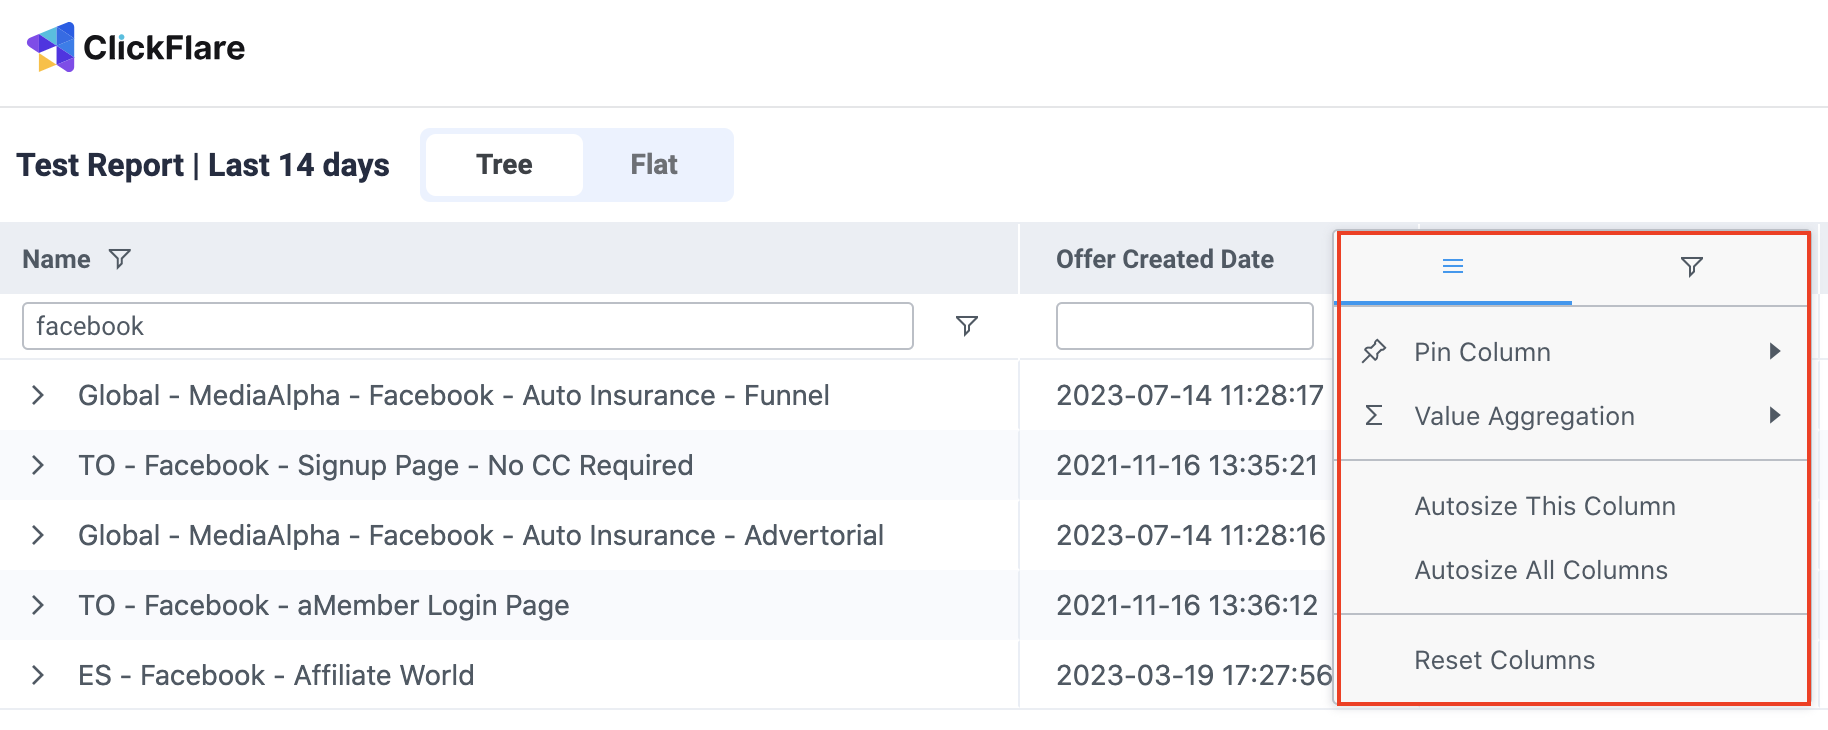
- Column settings: You can Pin, Autosize or Reset all columns. You can also apply different value aggregations such as average, sum, etc. Finally, you can order your columns in ascending or descending order by simply clicking on the column title.

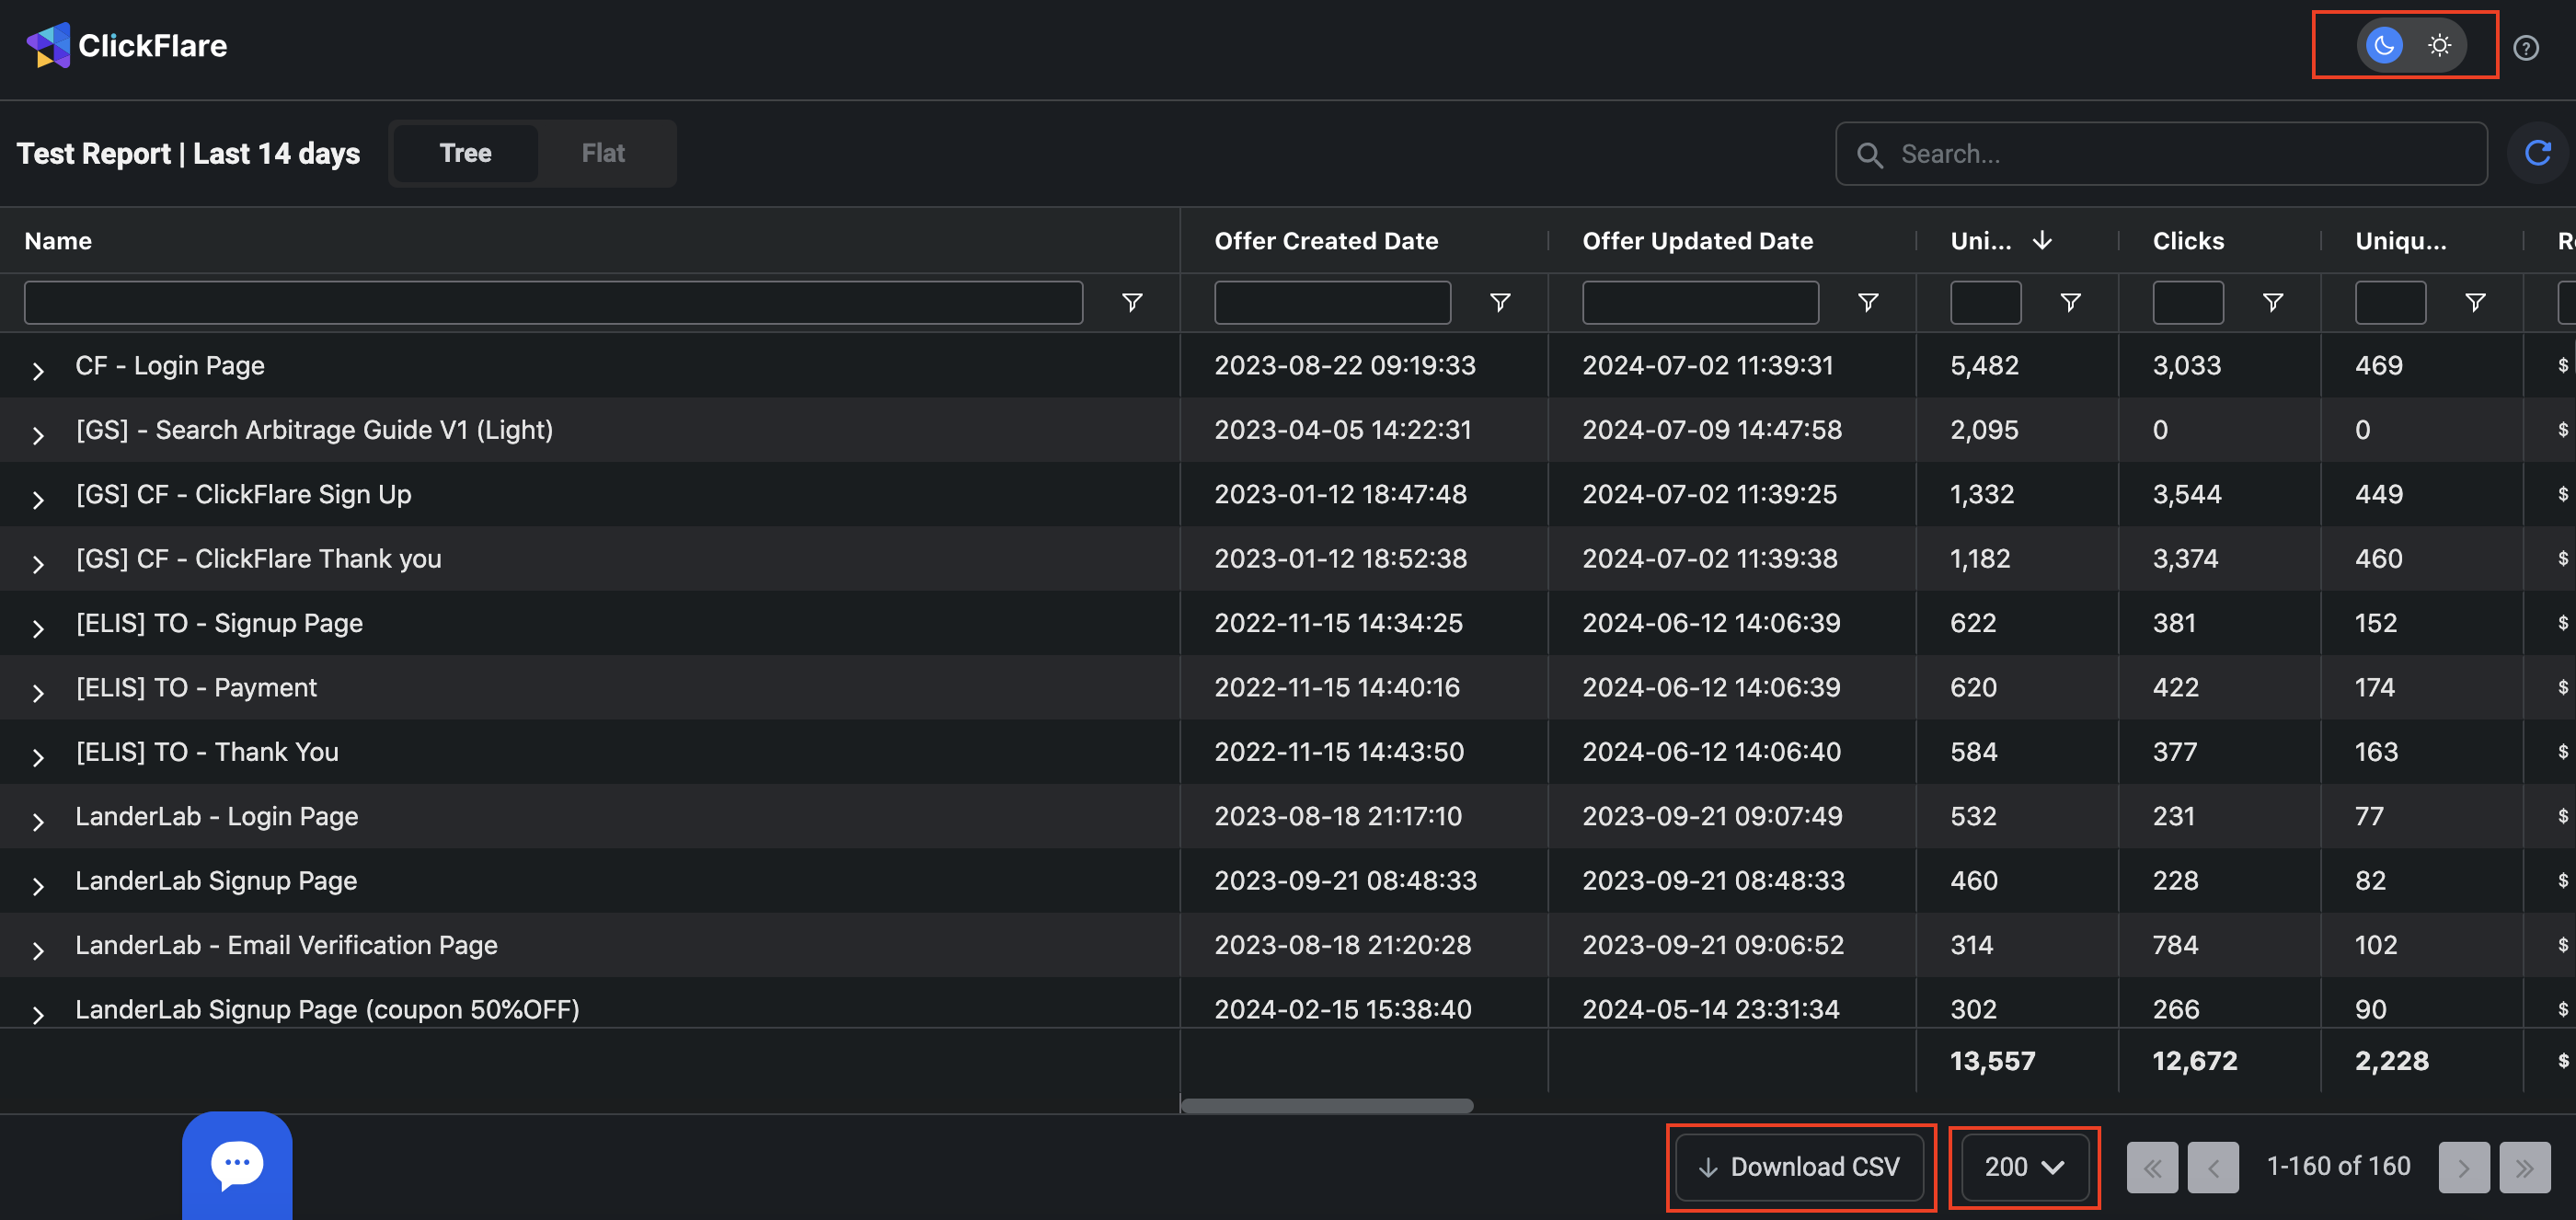
- Rows per page: You can choose to showcase anywhere from 5-200 rows per page. You can change this on the bottom left of your report.
- Download CSV: If you wish to download this report, again on the bottom left you see the Download CSV option.
- Dark vs light mode: You can also change the report mode to display a dark or light background according to your preferences.

Related Articles