Date Range
Every table is scoped to a date range. The selector sits in the top-right corner of the screen and defaults to the last 30 days. Click it to choose a preset (Today, Yesterday, Last 7 Days, Last 30 Days, This Month, Last Month, Last 3 Months, Last 6 Months) or pick a custom start and end date from the calendar.
Click Apply after making your selection. The table, the metric tiles above it, and any graph update together.
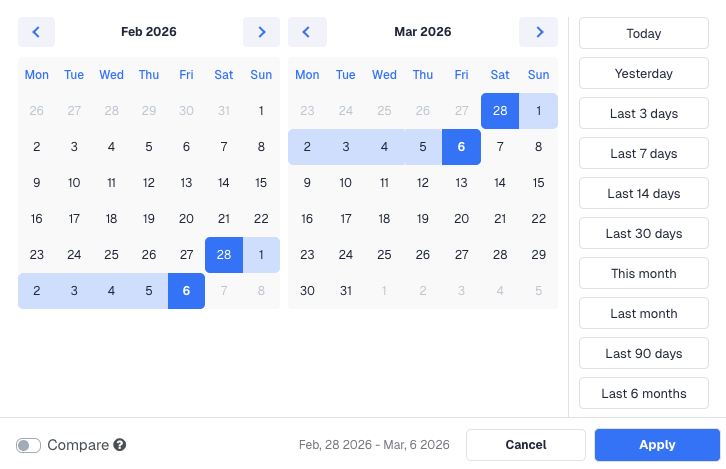
The percentage change shown on each metric tile always compares against the same-length period immediately before your selected range. If you select Last 7 Days, the comparison is against the 7 days before that. There is no separate "compare to" selector needed.
Filtering
ClickFlare has two distinct filtering mechanisms. They work independently and can be used at the same time.
Filter by (global filter)
The Filter by button sits in the top-left of any table view. Clicking it opens a panel that lets you filter the entire table by the attributes set at campaign creation time: Traffic Source, Country, and Device. For example, selecting Country = United States shows only campaigns where the campaign was created with US as the target country.
This filter also includes a Show Archived toggle at the top, which is off by default. Turn it on to include archived items in the results alongside active ones.
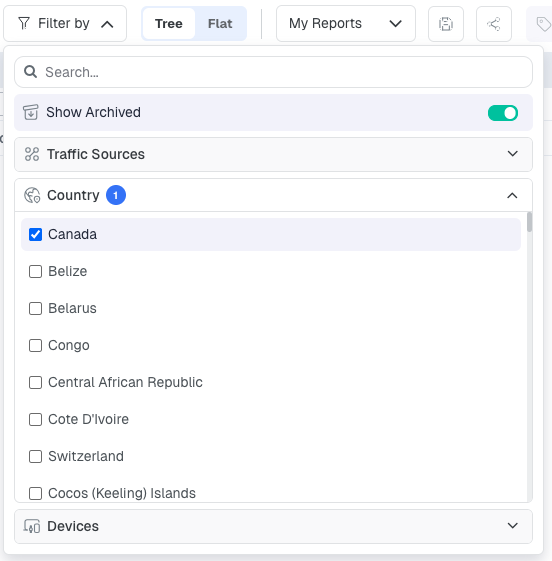
The global filter is based on what was selected when the campaign was created: its assigned traffic source, target country, and device type. It does not filter by the actual visit-level data inside the campaign.
Column filters
Every column header has a small filter (funnel) icon next to it. Clicking it opens an inline filter for that specific column. You can set a condition using numeric operators: Equals, Less than, Less than or equals, Greater than, or Greater than or equals, followed by a value.
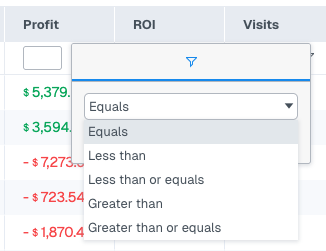
The key advantage of column filters is that you can apply them to multiple columns at the same time. For example, you can filter for Visits greater than 1,000 and ROI greater than 50% and Cost less than 500 simultaneously, all in separate column filters. The table shows only rows that satisfy every condition at once.
The global filter and column filters stack on top of each other. A common workflow is to use the global filter to scope down to a specific traffic source or country, then use column filters to surface only the rows within that scope that meet a performance threshold.
If you regularly use the same filter combination, save it as a custom report so you can reload it in one click next time.
Group By
Group By changes how the table organises its rows. Instead of listing campaigns, you can group the same data by country, device type, traffic source, day, hour, browser, OS, or dozens of other dimensions.
The Group By selector sits in the toolbar above the table. Click it and choose your dimension from the dropdown. The table immediately reorganises around that dimension while keeping all the same metric columns.
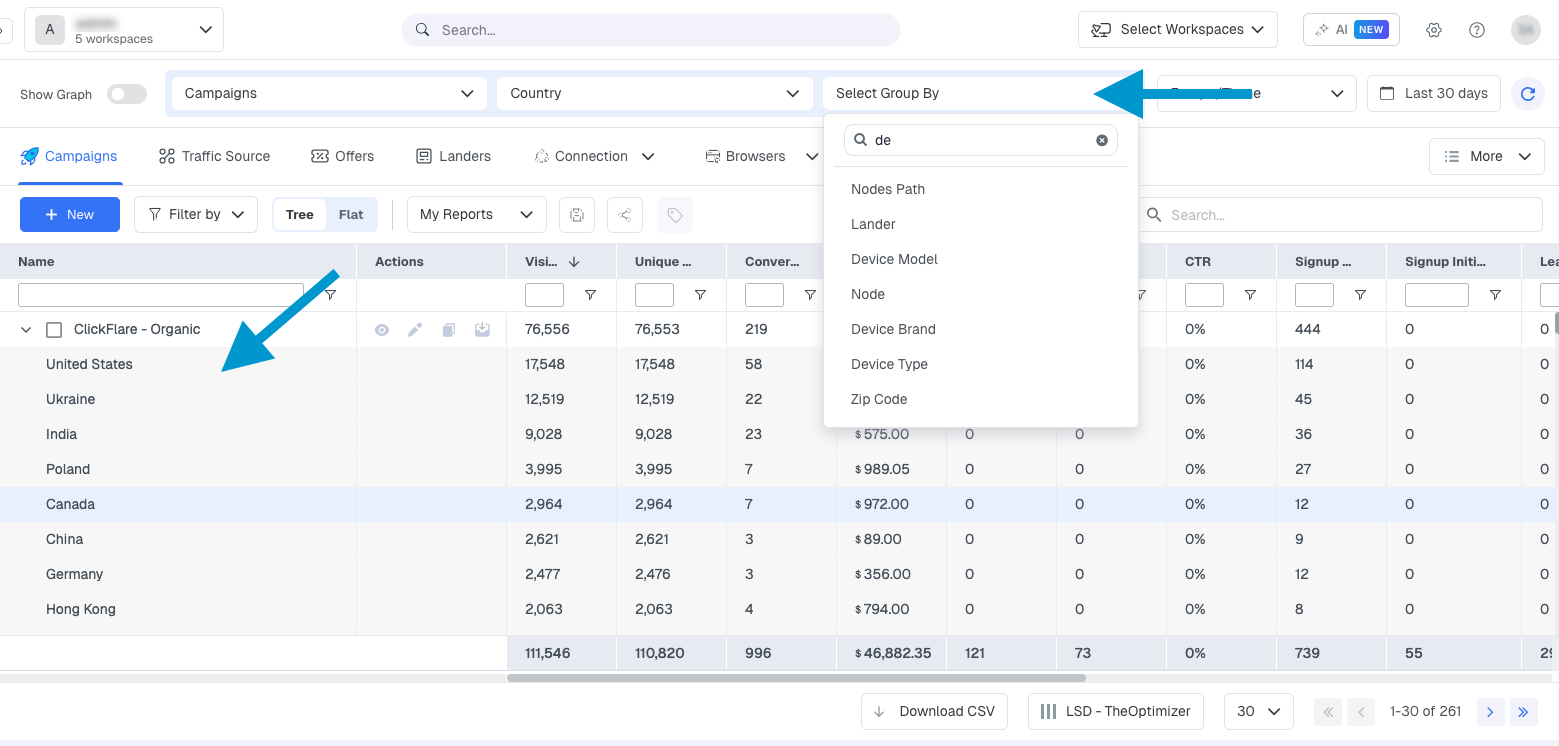
This is one of the most powerful features in ClickFlare for diagnosing performance. For example, grouping a campaign's data by Country shows you which geos are driving conversions vs. which are burning cost. Grouping by Hour of Day shows you your best and worst performing hours so you can schedule your ads accordingly.
Group By and filters work together. Apply a filter first to scope the data to a specific campaign or traffic source, then use Group By to break that subset down by whatever dimension you want to analyse.
Customising Columns
By default each table shows a standard set of columns. You can add, remove, reorder, and rename columns to match exactly what you want to see.
Click the Columns button at the bottom of the screen. The Table Settings panel opens on the right. From here you can:
- Show or hide columns by toggling the checkbox next to each one
- Reorder columns by dragging and dropping them up or down the list
- Rename columns by clicking the column name and typing a new label
Click Save when you are done. Your column configuration is saved per table view and persists between sessions.
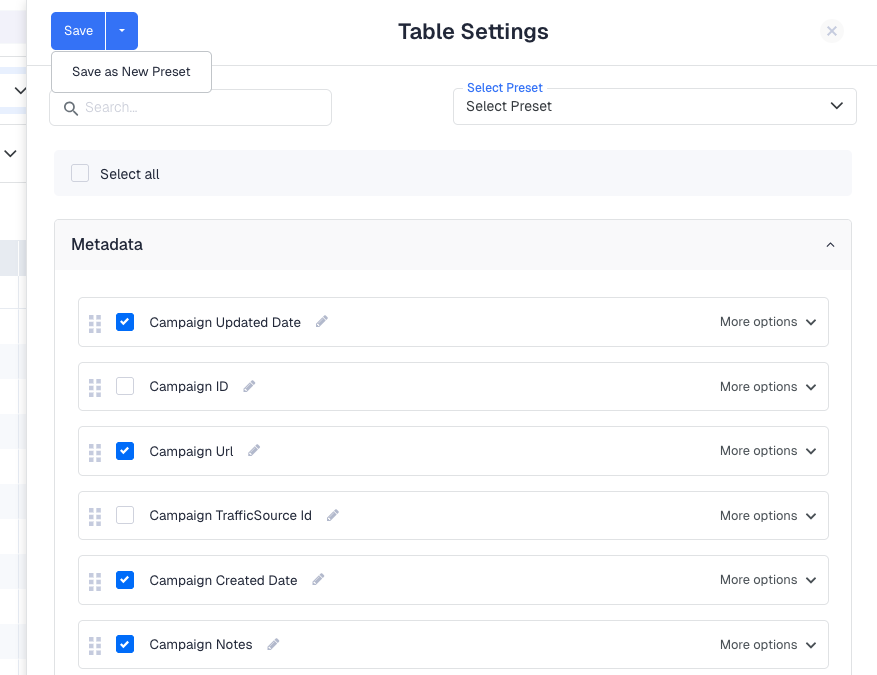
If you regularly switch between different column configurations, save each one as a preset using the Select Preset option at the top of the Table Settings panel. You can then switch between saved layouts in one click without reconfiguring manually.
Sorting
Click any column header to sort the table by that column. Click once for descending order (highest to lowest), click again for ascending order. The currently active sort column is indicated by a small arrow in the header.
Sorting by Profit descending is a quick way to see your most profitable campaigns at the top. Sorting by Cost descending shows where your budget is going. Sorting by ROI ascending surfaces your worst-performing campaigns immediately.
Hidden Features
These features are not visible in the toolbar and most users never discover them. They are accessed by selecting rows in the table first.
Selecting rows
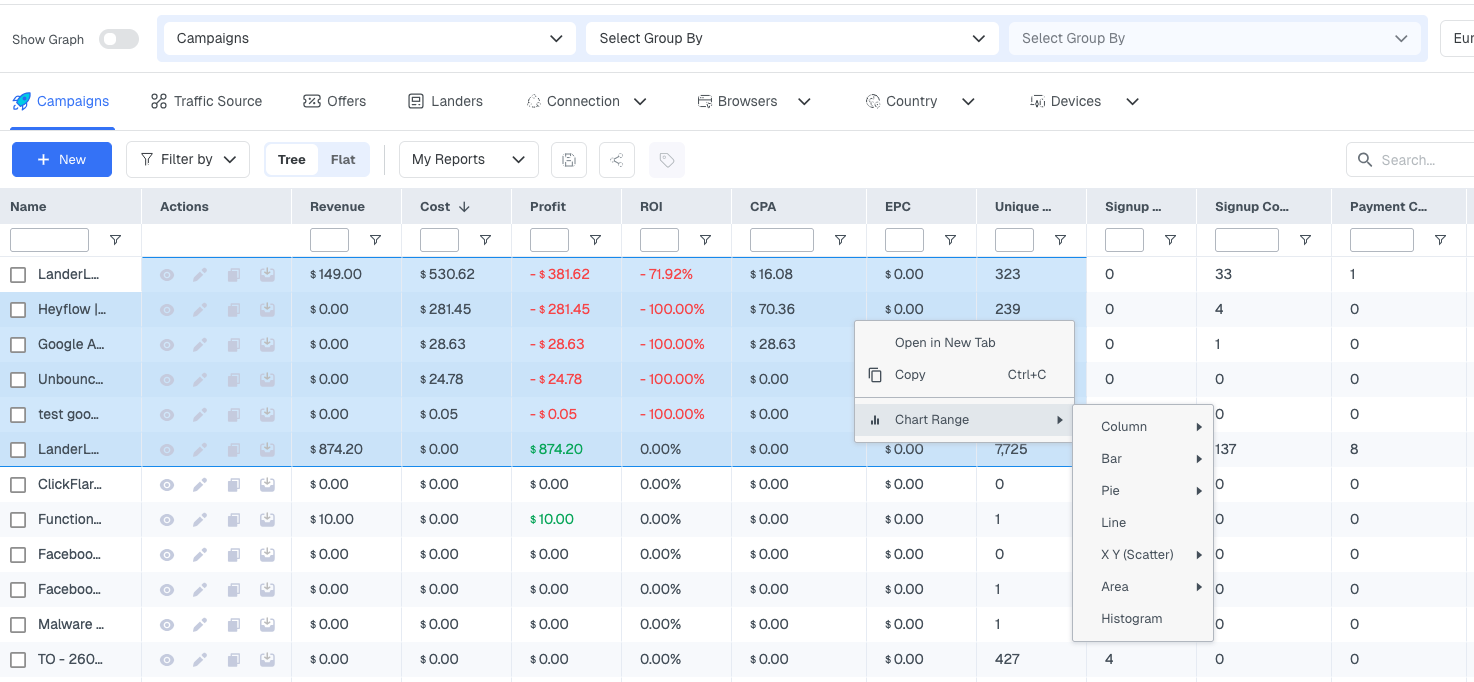
Click and drag across any cells in the table to select a range of rows and columns. You can also click a single row to select it. Once rows are selected, right-clicking opens a context menu with additional options.
Copying table data
After selecting rows, right-click and choose Copy. The selected data is copied to your clipboard as tab-separated values, which paste cleanly into Excel, Google Sheets, or any text editor as a properly formatted table.
Creating charts from selected data
After selecting rows, right-click and choose Chart Range. ClickFlare generates an interactive chart from the selected data instantly. You can change the chart type (bar, line, pie, etc.), adjust formatting, add or remove elements, and download the chart as an image using the Download Chart icon in the chart toolbar.
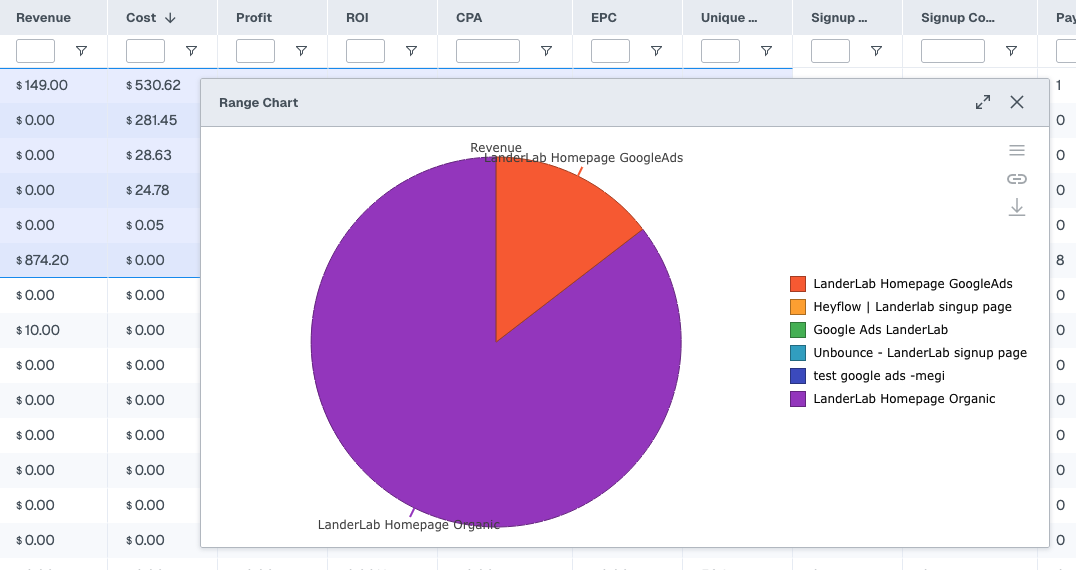
Chart Range is most useful when you have already filtered and grouped data down to a specific comparison, such as revenue by country for a single campaign. Charting the raw full table is rarely useful. Narrow first, then chart.
FREQUENTLY ASKED QUESTIONS
Got questions? Find the answers below:
Q1: My filters are not showing the data I expect. What should I check?
A1: First check that your date range covers the period you are looking for. Then check that your filter conditions are not too restrictive, as stacking multiple filters can sometimes exclude more data than intended. Try removing filters one at a time to identify which condition is narrowing the results unexpectedly.
Q2: Can I save a filter and Group By combination for later?
A2: Yes. Once you have set up your filters and Group By, save the view as a custom report using the My Reports option. The saved report stores your filter conditions, Group By dimension, column configuration, and date range preset so you can reload the exact same view any time.
Q3: Can I export table data to a CSV?
A3: Yes. The Download CSV button appears in the bottom bar. It exports all rows currently visible in the table, respecting any active filters and Group By settings. If you only want a subset, use the right-click Copy method instead to grab selected rows directly.
Q4: Do my column customisations apply to all tables or just one?
A4: Column settings are saved per table. Your Campaigns table column layout is saved separately from your Offers table layout, your Landers layout, and so on. Changes in one table do not affect the others.